Real-time Insights: The Power of Container Monitoring
Developers

Containers have emerged as one of the most widely used application deployment methods. In your cloud container environment, every millisecond and megabyte matters. Performance bottlenecks and system inefficiencies can silently but steadily undermine your operational margins and customer experience. Container monitoring can help you shift from fixing issues after they happen to prevent them from happening in the first place.
Container monitoring is the process of gathering data and monitoring the condition of microservices environments and containerized apps, to make sure everything is running properly. This set of practices can serve as an early-warning system for your mission-critical data and operations. Businesses can make better decisions about when to scale in/out instances, tasks, and pods, change instance types, and purchase options by having visibility, not only at the cluster or host level but also within the container runtime and application.
The benefits of container monitoring
Imagine your cloud infrastructure as a living, breathing ecosystem. Each container is like a specialized cell, constantly creating, scaling, and sometimes failing. Without comprehensive monitoring, you’re essentially trying to manage a complex biological system blindfolded. Today’s cloud services demand real-time visibility, predictive insights, and the ability to diagnose and resolve issues before they cascade into full-blown system disruptions.
By tracking your container performance metrics, logs, and traces, you can make smarter decisions about scaling your infrastructure. Understanding exactly how your resources are being used helps you optimize instance sizes, choose the right purchasing options, and ensure you’re not over or under-provisioning your cloud resources.

Automated alerts can help teams respond faster to potential infrastructure problems. For example, you can set up monitoring to automatically warn your team when resources are running low, or even trigger the addition of new servers before you run out of computing power. This approach prevents potential system overloads by catching issues before they become critical.
Here are some other key benefits you’ll get from monitoring your containerized platforms:
- You can track your application’s performance from both a technical and business perspective, giving you a complete view of how your systems are working.
- By connecting logs and events, you can spot potential problems before they cause serious issues, helping you prevent disruptions instead of just reacting to them.
- The ability to examine each layer of your system means you can quickly identify exactly where a problem starts, making troubleshooting faster and more precise.
The hidden challenges of containerized environments
Unlike traditional virtualized infrastructure monitoring, container environments have some inbuilt complexities that can trip up even experienced IT teams. Here are a few that our DevOps team have identified:
- Resource sharing: When multiple containers share the same server resources, tracking exactly how much memory and CPU each one is using becomes complicated. This makes it hard to get an accurate view of how well your containers and applications are actually performing.
- Inadequate Tools: Most traditional monitoring tools were designed for older server setups and simply couldn’t keep up with container environments. They miss critical details about how containers are actually performing, making it hard to diagnose problems or understand your system’s real-time health.
- Pod Failures: The smallest units in Kubernetes, pods are made up of one or more containers that share network resources, storage, and operating parameters. Each pod has a distinct IP address within the cluster, making them the basic building elements of a Kubernetes cluster. If a container fails, Kubernetes may restart another container, thus hampering the monitoring.
- Short life-spans: Containers can spin up and shut down almost instantly, which is great for flexibility but makes tracking your system like trying to take a snapshot of a lightning-fast moving target.
Strategies for container monitoring
A robust monitoring platform is crucial when integrating multiple metric sources. It should provide a unified view of your entire system. Your development team needs to invest significant effort in ensuring data correlation for seamless end-to-end debugging.
Monitoring containerized applications is similar to traditional applications, requiring data from various layers. To optimize resource management, including scaling, you’ll need to monitor infrastructure metrics and container-level metrics. For effective application debugging, you’ll also need to monitor application-specific data, performance metrics, and trace information.
A service mesh, using a sidecar proxy pattern, controls the communication layer of your microservices architecture. Each service has its own proxy, and the mesh comprises all these proxies. This approach simplifies network management and observability by offloading network functions to the proxies. In case of issues, identifying the root cause becomes much easier.
During deployment, your service mesh can manage application traffic, including load balancing, scaling, and routing. Some other benefits your service mesh can offer you include:
- Provides insights into metrics, logs, and traces across the entire stack.
- Ensures consistent communication between services.
- Offers full visibility into end-to-end communication.
- Simplifies the implementation of distributed architectures, handling network-level concerns like circuit breaking, rate limiting, and retries. Its platform-agnostic nature allows you to build services using any programming language.
Tools to help you master container monitoring
A plethora of tools can help you monitor your cloud container infrastructure. Here are four popular options:
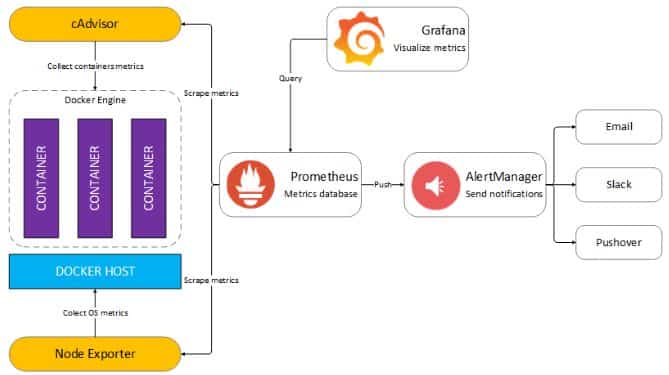
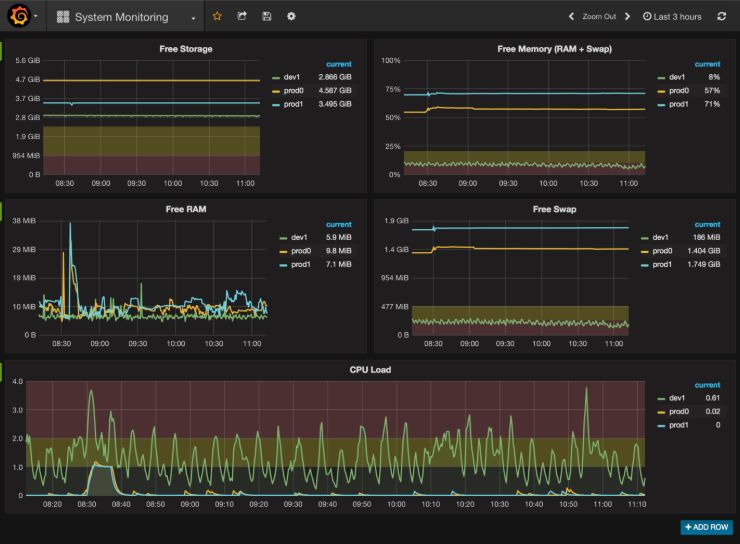
- Grafana, an open-source data-series visualization package, has a large list of supported data sources, making it a solid solution in many situations.

- Prometheus is an open-source tool for collecting, aggregating, analyzing, and visualizing metrics data. It’s often the default monitoring solution for Kubernetes deployments and can integrate with various infrastructures, resources, and applications. Prometheus client libraries enable instrumentation of applications, storage and querying of time-series data, and visualization of system health.
- Graphite is an open-source tool for monitoring cloud and on-premises resources. It’s designed to store, visualize, and share time-series metrics and data. While Graphite itself doesn’t directly collect data, it integrates with a vast ecosystem of compatible collection agents.
- Zabbix is a comprehensive network and system monitoring tool, centralized in a web-based console. It can monitor and collect data from a variety of servers and network devices, providing service and performance insights.
Bottom line
The goal of container monitoring is to collect operational and monitoring data, such as events, logs, metrics, and traces. This allows for timely identification and resolution of issues, minimizing disruptions. An effective monitoring system can automatically trigger alerts and take action when predefined thresholds are reached.
Monitoring containerized applications and infrastructure is crucial. Tools like Prometheus and Grafana provide the necessary visibility and insights to optimize performance, security, and compliance of cloud resources.
Ultimately, a successful container strategy relies on robust monitoring. By implementing effective container monitoring, you can ensure the performance, security, and compliance of your cloud applications and infrastructure, while improving efficiency and reducing costs.
