


ClickHouse is a high-performance, column-oriented SQL database designed for online analytical processing (OLAP). It efficiently processes massive datasets with complex queries, making it ideal for real-time analytics. Unlike traditional row-oriented databases, ClickHouse stores data in a columnar format, significantly improving query speed by reading only the necessary columns from disk. It also supports features like data replication, role-based access control, and adaptive join algorithms, ensuring both performance and scalability.
In this guide, we will walk you through the installation process of ClickHouse on Kamatera, covering step-by-step setup instructions and providing examples to help you get started with running queries efficiently. Whether you’re new to ClickHouse or looking to optimize your analytics workload, this guide will equip you with the essential knowledge to get up and running.
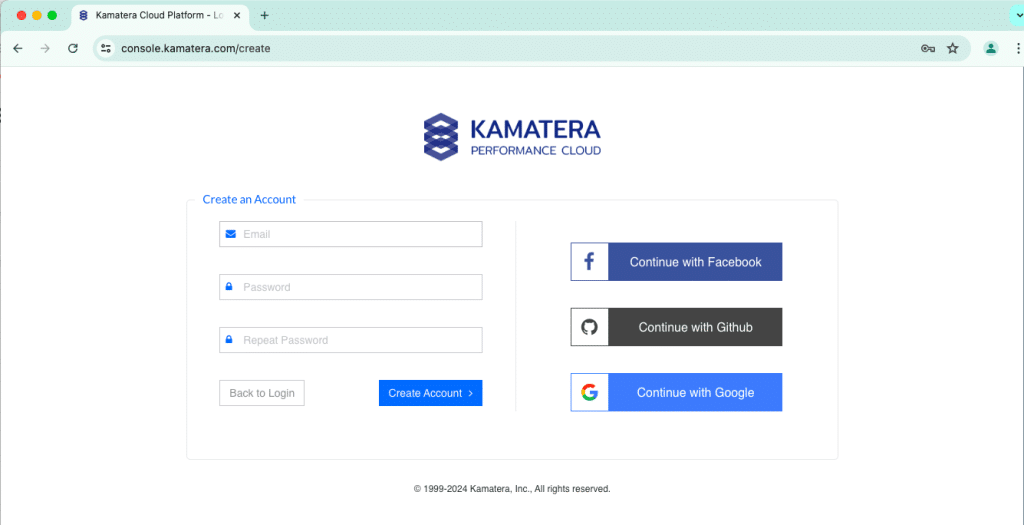
First, let’s create an account on Kamatera.
Go to console.kamatera.com and sign up for an account by providing the following information:
- Verify Your Email: Click the verification link sent to your email by Kamatera.
- Password: Enter your password.
- Repeat Password: Re-enter your password and click Create Account.
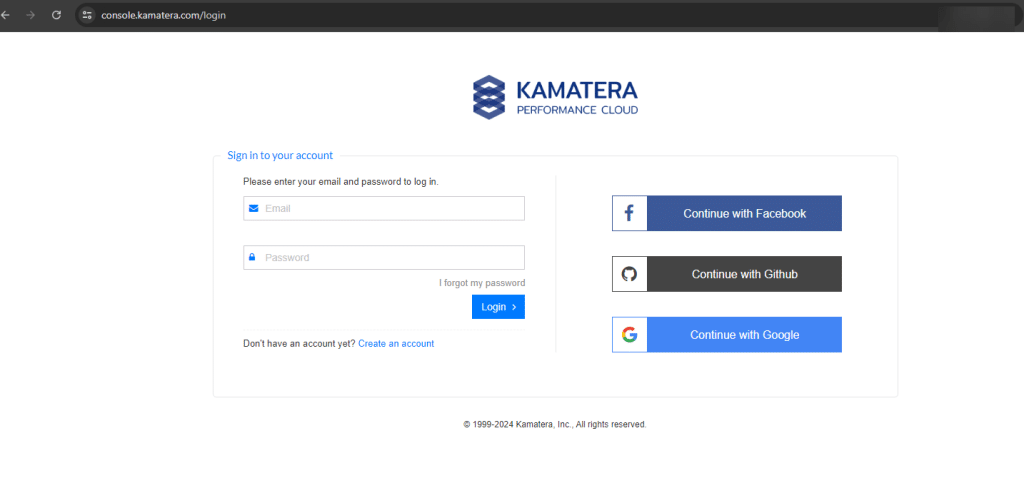
Access the Kamatera Management Console
Enter your username and password and click Login to access Kamatera Management Console.
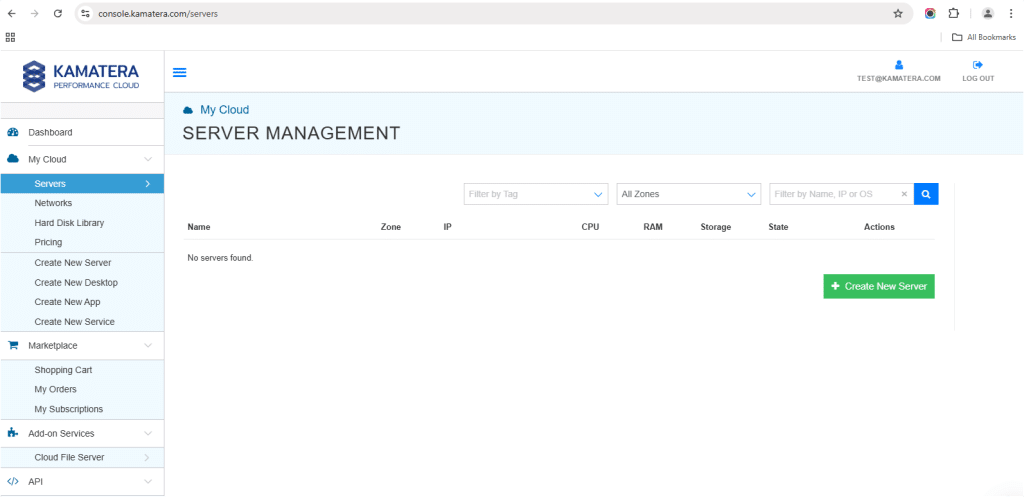
- Navigate to My Cloud on the left pane, select Servers and click on Create New Server or click on Create New Server on the right pane.
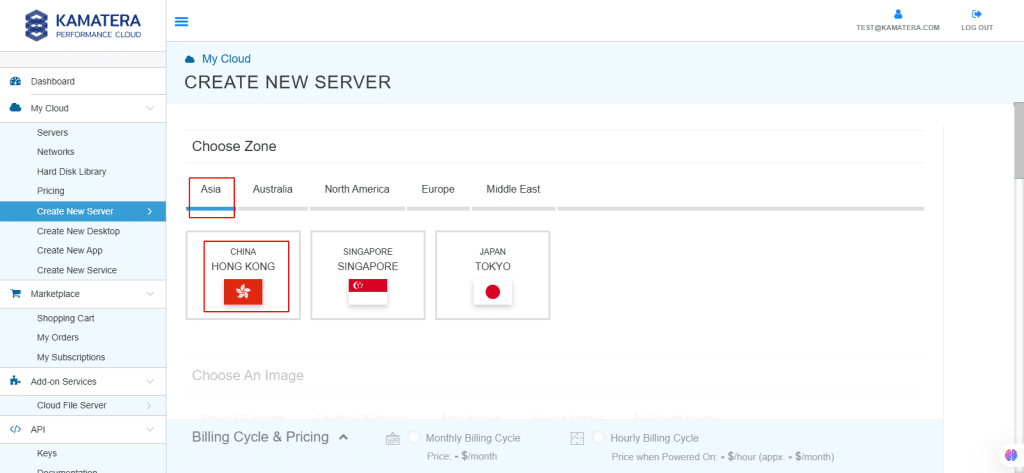
2. Choose Zone
Choose the Zone according to your requirements
- Asia
- North America
- Europe
- Middle East
Note: For this setup, we used the Asia server domain to set up the Ubuntu Server.
3. Choose An Image
Kamatera offers a variety of App and Server Images to help users set up preconfigured resources. Users can explore options such as
- Server OS Images
- Desktop OS Images
- App Images
- Service Images
- My Private Images
In this, select Server OS Images and select Ubuntu.
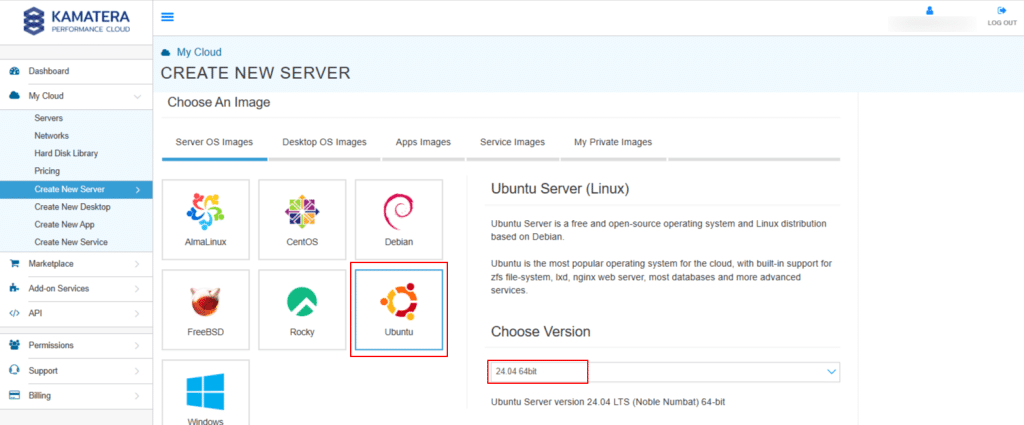
Under Choose Version, from the drop-down menu, select the latest version of Ubuntu.
Note: Always select the latest version.
Once the version is selected you can see message as: “Ubuntu Server version 24.04 LTS (Noble Numbat 64-bit)”
4. Toggle the Detailed view button to enable you to view the detailed description, including the price.
For this use case, below Server Specifications are used.
Note: Select the Server Specs according to your requirements.
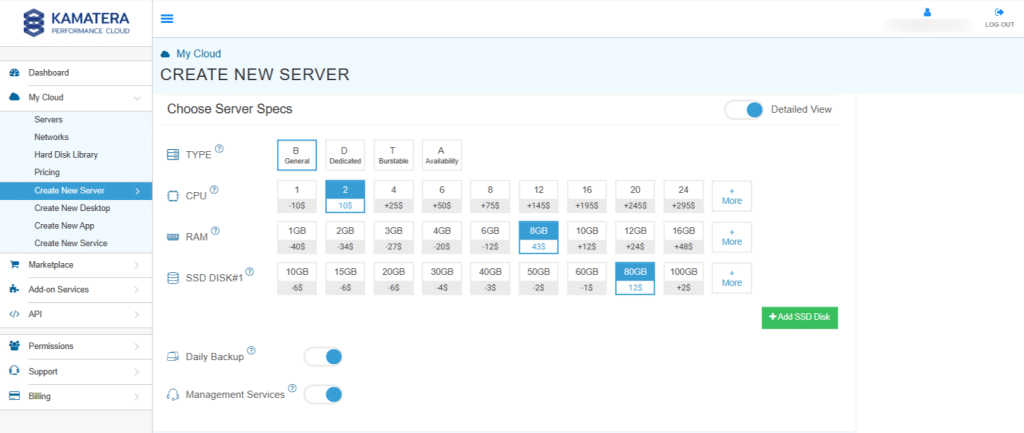
Choose Server Specs
| Field | Description |
| Type | Type B-General Purpose– Server CPU are assigned to a dedicated physical CPU thread with reserved resources guaranteed.
Type D–Dedicated – –Server CPU are assigned to a dedicated physical CPU Core (2 threads) with reserved resources guaranteed. Type T – Burst – Server CPU are assigned to a dedicated physical CPU thread with reserved resources guaranteed. Exceeding an average usage of 10% will be extra charged for CPUs usage consumption. Type A-Availability- Server CPUs are assigned to a non-dedicated physical CPU thread with no resources guaranteed. Note: More information on CPU types is available on the My Cloud- Pricing page. |
| CPU | Choose the number of vCPUs that will be installed on the server. Type B/T can be configured with up to 104 vCPUs per server. Based on Intel’s latest Xeon Processors, 2.7 GHz+. |
| RAM | Choose the amount of RAM that will be installed on the server. Type B/T/D can be configured with up to 512GB RAM per server. |
| NVMe SSD DISK | Choose NVMe SSD Storage Size. You can add up to 15 NVMe SSD Disk. NVMe SSD Storage includes unlimited IOPS and unlimited storage bandwidth, free of charge. |
| Daily Backup | Toggle the switch to enable extended daily backups of your server’s storage to external backup storage. |
| Management Services | Toggle the switch to enable Management Services to the server’s operating system by Kamatera Technical Support Team. |
5. Choose Networking
Users can select the network they wish to use, whether it is a public Internet network or a private local network.
Simple Mode
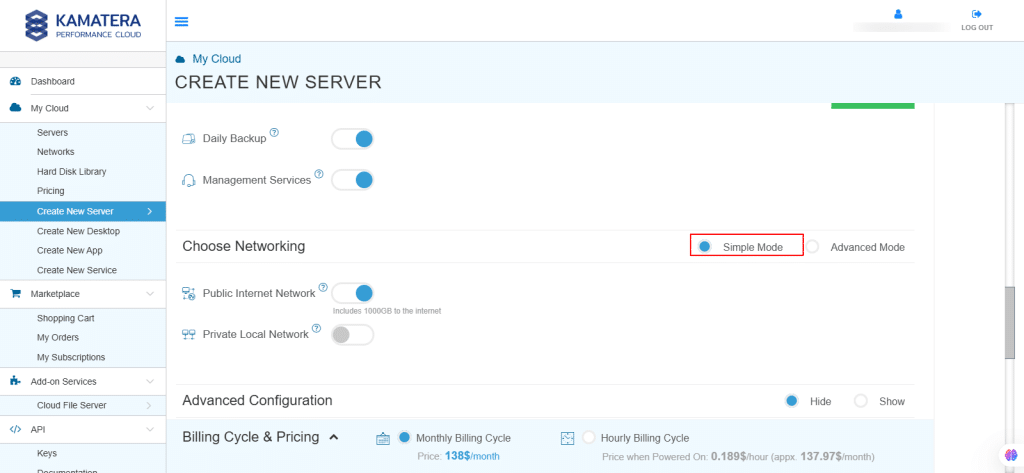
| Field | Description |
| Public Internet Network | Check to connect the server to a network interface connected to Public Internet Network. |
| Private Local Network | Check to connect the server to a network interface connected to Private Local Network. |
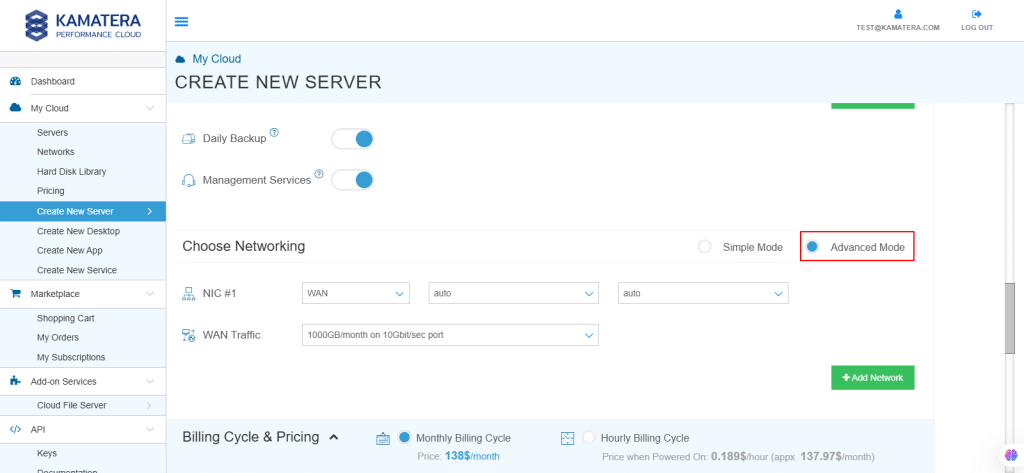
| Field | Description |
| NIC #1 | Select WAN from the options available in the drop-down menu.
Select auto from the options available in the drop-down menu.
Select auto from the options available in the drop-down menu.
|
| WAN Traffic | Select 5000 GB per month/ on 10 Gbit per second port. |
6. Advanced Configuration
Hide – If the user wants to hide the advanced configuration.
Show – If you want to see the advanced configuration.
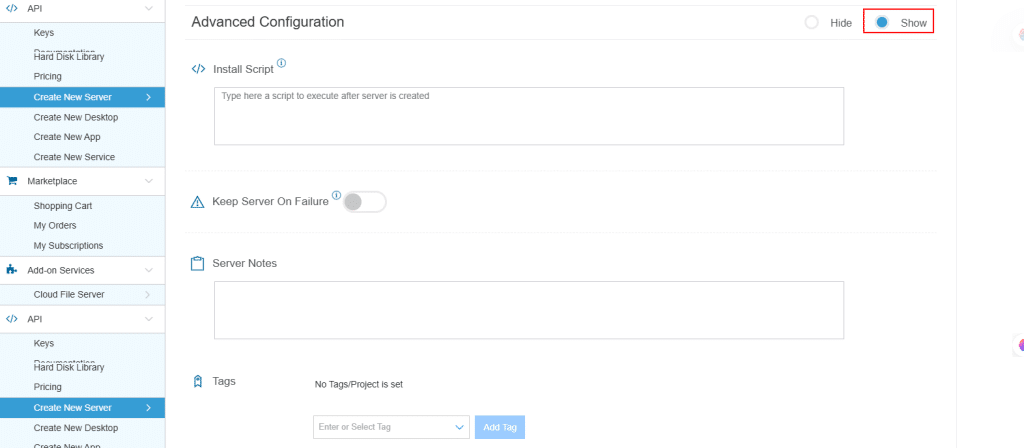
| Field | Description |
| Install Script | Enter the script here to execute once the server is created.
Note: For Windows system use Power Shell. |
| Keep Server On Failure | Do not terminate server if Start up Script or Provisioning Fails |
| Server Notes | Enter any server notes to be noted. |
| Tags | Select the Tags from the drop-down menu and click Add Tag. |
7. Finalize Settings
Finalize settings by setting the password, re-validating it, selecting the number of servers, specifying the server’s name, and enabling the Power On Servers option.
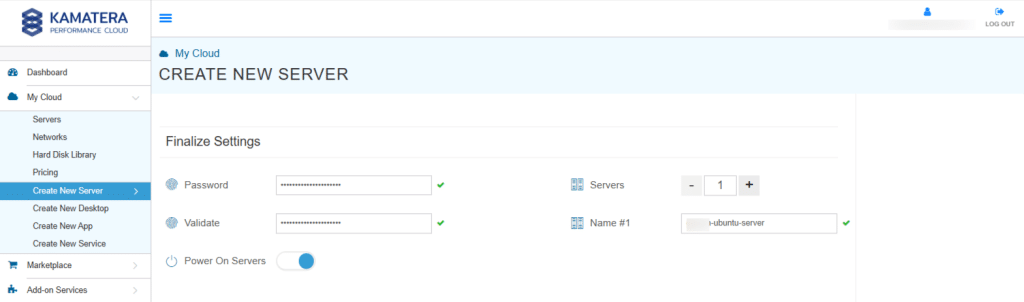
| Field | Description |
| Password | Select password
Password allowed characters: a-z, A-Z,0-9 !@#$^&*()~ and must need the following requirements:
|
| Validate | Re-enter the password to validate. |
| Servers | Select the number of servers the user wants. |
| Name # 1 | Enter the name of the server. |
| Power On Servers | Switch on the toggle button to see the details |
Note: Once the user enters the details in Finalize Settings, they can select either the Monthly Billing Cycle or Hourly Billing, depending on their requirements.
8. Billing Cycle and Pricing
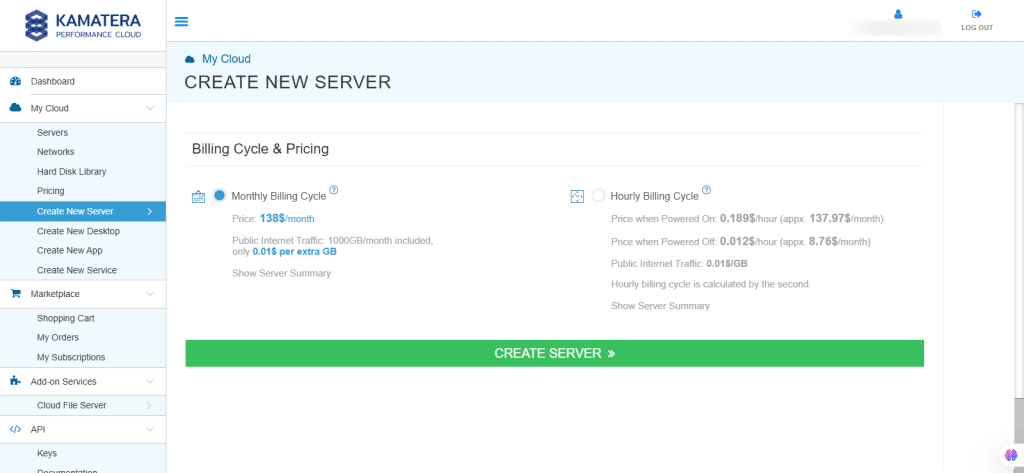
The user can choose between the Monthly Billing Cycle and Hourly Billing Cycle.
Note: The Server Summary displays the location, operating system (including server specifications), add-on services, servers, and pricing.
Click Create Server.
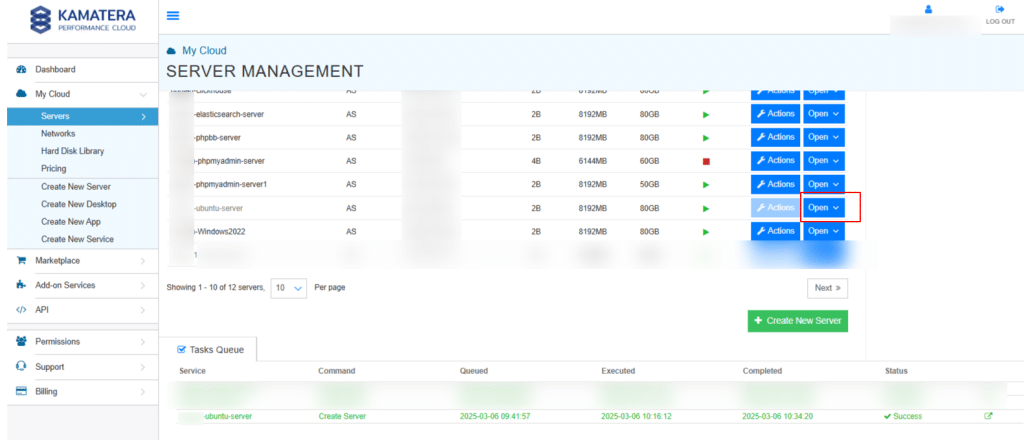
9. In Tasks Queue, you can see the Ubuntu Server is downloading.
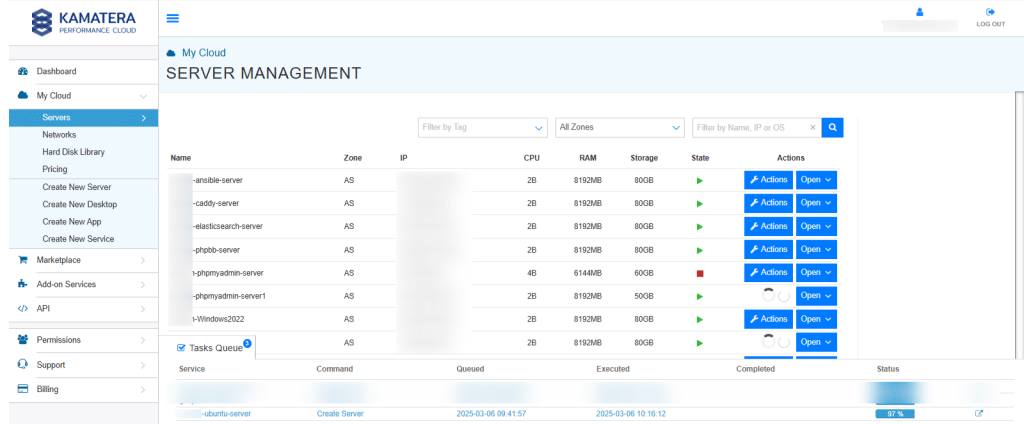
10. Once the installation is successful, you will message as Success beside the server’s name and Ubuntu Server is reflected in the Server Management dashboard.
Click Open, beside the Ubuntu Server.
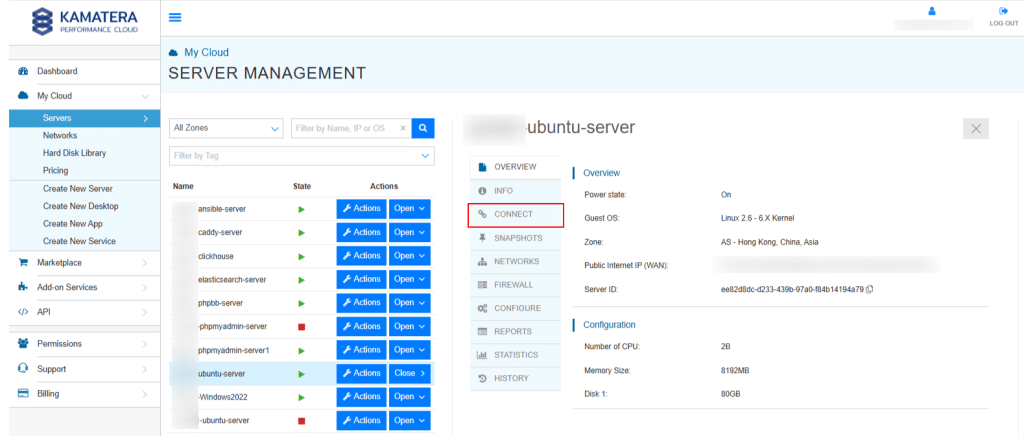
11. A new screen shows up. The Overview tab in the center is selected by default and it displays information like Power state, Guest OS, Zone, Public Internet (WAN), Server ID of the server and Configuration-Number of CPU. Memory Size, Disk 1.
Click on Connect to connect to the server.
12. Now, click on Open Remote Console to open a new terminal.
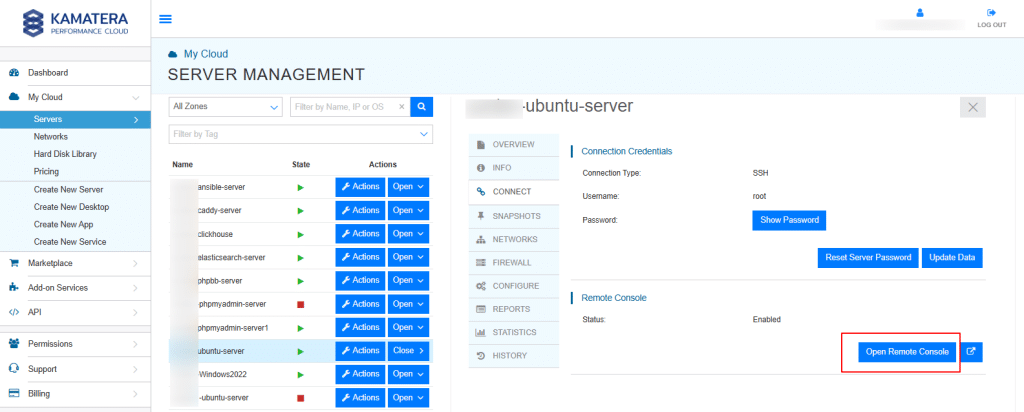
13. In the terminal, enter the Username and Password that you mentioned while creating a server (step-7).
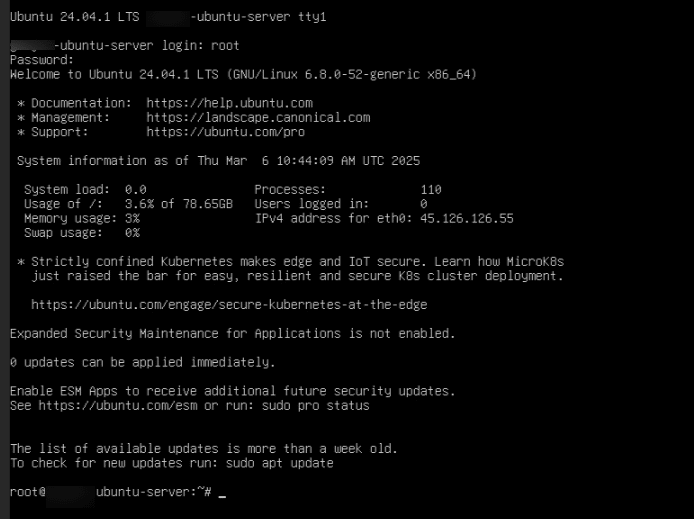
14. As we are accessing the server via SSH, you won’t have a GUI-based terminal like gnome-terminal. Instead, you can open multiple SSH sessions or use terminal multiplexers like tmux to manage multiple command prompts efficiently.
To do this, first connect via SSH by running the following command:
Command:
ssh root@<your_ip_address>
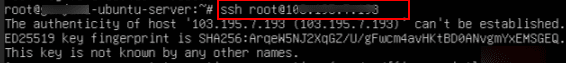
15. When prompted “Are you sure you want to continue connecting (yes/no/fingerprint)” enter yes.
You will see a message “Permanently added xxx.xx.x.xxx to the list of known hosts.”
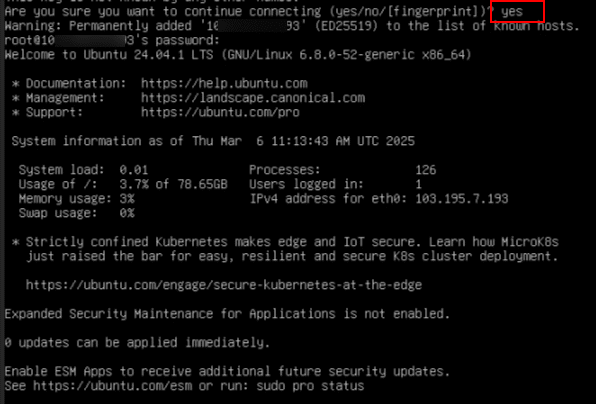
16. The following command ensures your system stays up to date.
Command:
sudo apt update && sudo apt upgrade
- apt update fetches the latest package information from repositories,
apt upgrade installs available updates for installed packages.
![]()
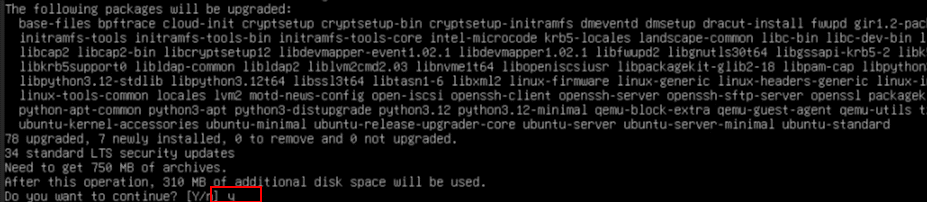
17. After updating and upgrading, you will see a prompt saying, “Do you want to continue?” Type y and press Enter to proceed, as shown in the screen below.
18. The following command installs tmux, a terminal multiplexer that allows you to manage multiple command-line sessions within a single terminal window.
Command:
sudo apt install tmux -y
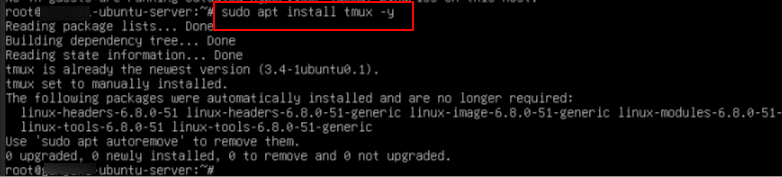
19. Once installed, tmux enables you to create multiple terminal sessions, making it easier to run and manage different processes simultaneously within the same window.
To open the tmux terminal, run the following command:
Command:
tmux
![]()
20. ClickHouse is compatible with Linux, FreeBSD, and macOS, and can also run on Windows using WSL. The easiest way to download ClickHouse locally is by running the curl command below. It automatically detects your operating system and fetches the appropriate ClickHouse binary.
Note: For more details, refer to the official ClickHouse documentation:
https://clickhouse.com/docs/getting-started/quick-start
- Now, run the below command to download ClickHouse.
Command:
curl https://clickhouse.com/ | sh
After running the command, you should see the message as:
Successfully downloaded the ClickHouse binary, you can run it as: ./clickhouse
You can also install it:
sudo ./clickhouse install
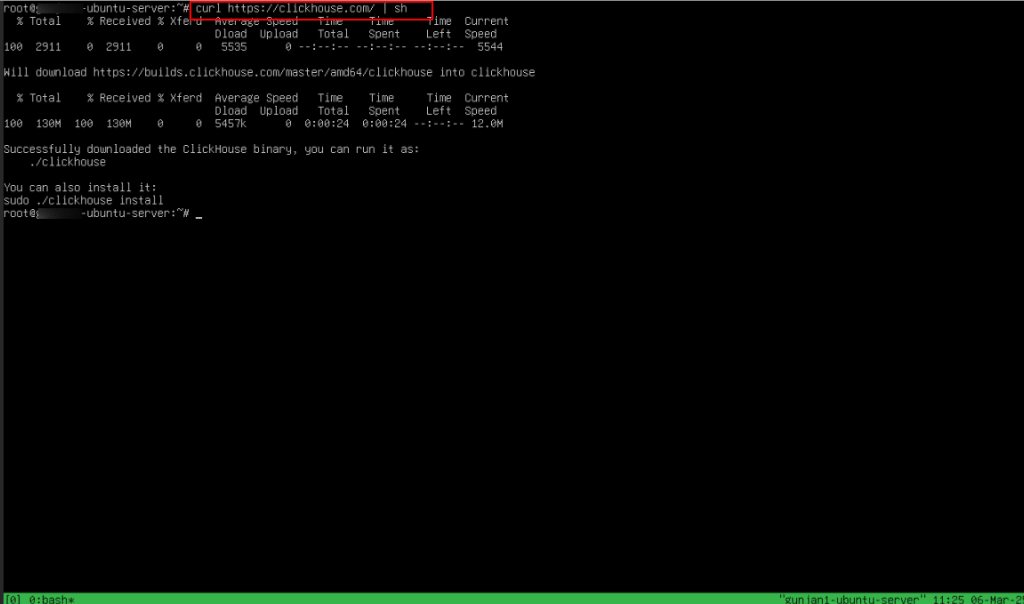
Note: At this stage, you can ignore the prompt to run the install command.
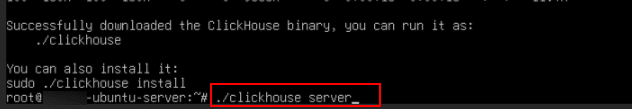
21. To launch the ClickHouse server, run the following command:
Command:
./clickhouse server
This command initializes the ClickHouse database server, allowing it to process queries and manage data.
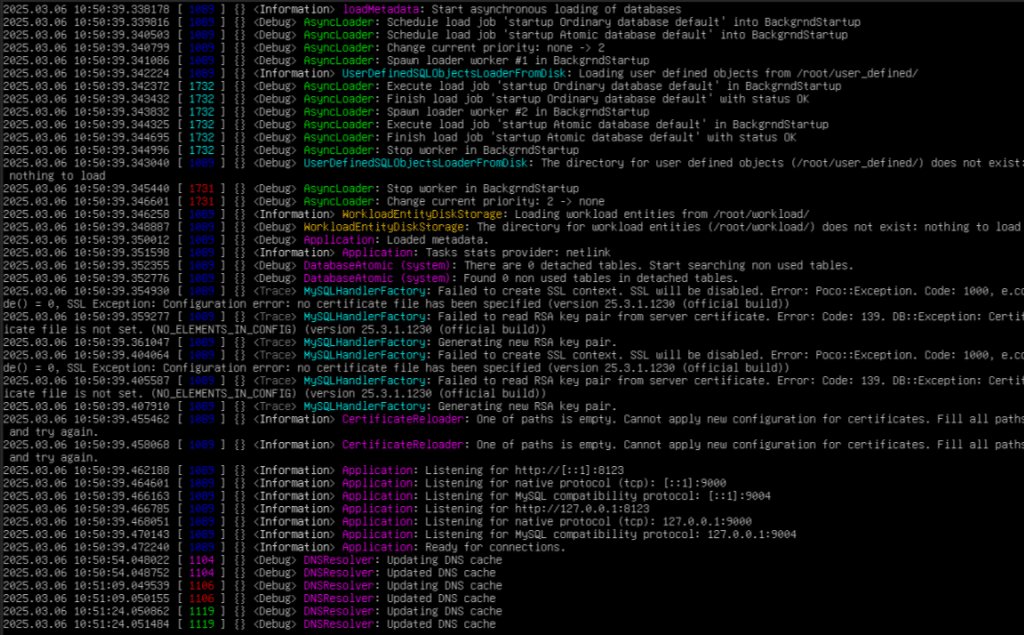
22. Once the command is executed, the terminal will begin displaying log messages. This is completely normal, as ClickHouse has a default logging level set to trace instead of warning. The trace level provides detailed logs, including internal operations and debugging information, which can be useful for monitoring and troubleshooting.
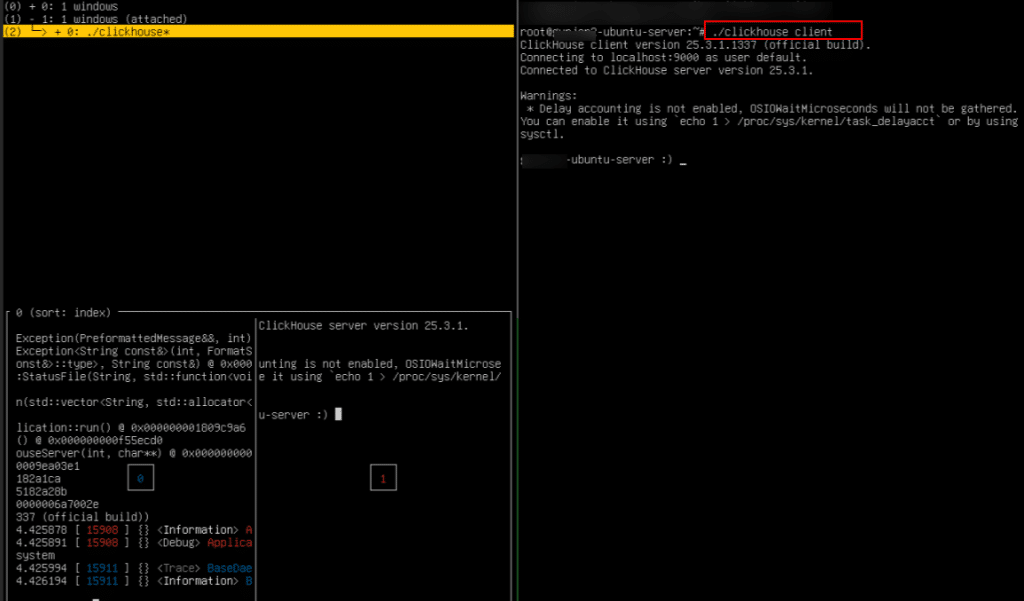
23. To open a new terminal session, press Ctrl+b, %. This allows you to run multiple commands in parallel.
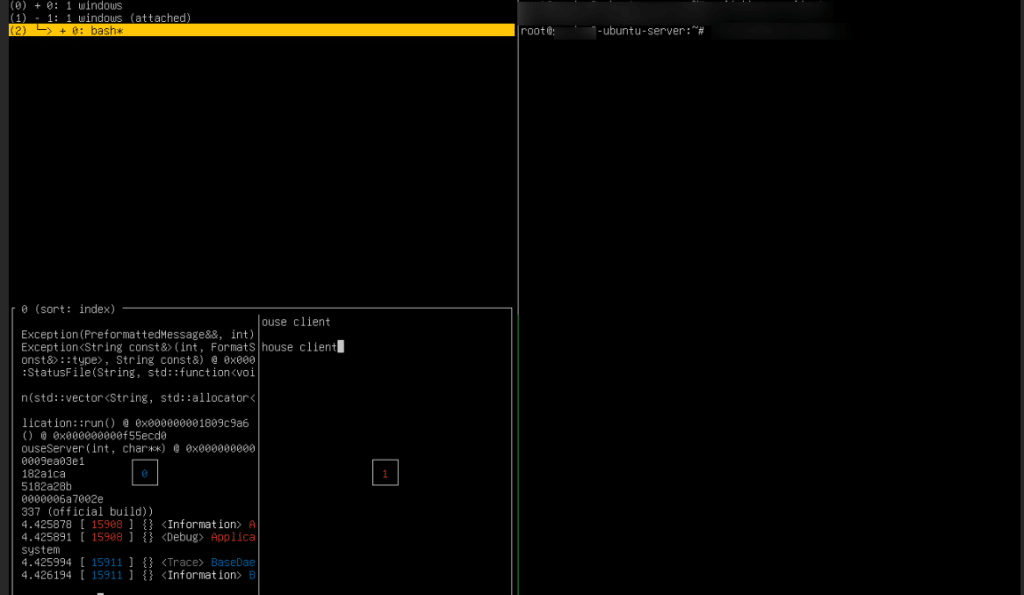
24. In the new terminal, run the following command:
Command:
./clickhouse client
You should see a smiling face 🙂 indicating a successful connection to your ClickHouse service running on localhost.
Note: By default, ClickHouse uses port 9000 for client connections. When you connect using clickhouse-client, it communicates with the server through this port, allowing you to execute SQL queries on your system.
25. CREATE TABLE:
Now, let’s create a table and execute some queries.
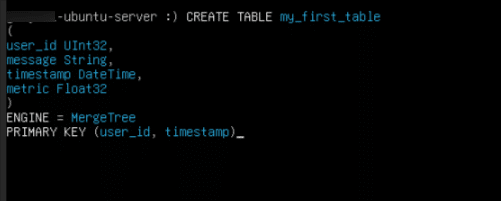
In ClickHouse, the CREATE TABLE command is used to define a new table. While it follows standard SQL DDL syntax, ClickHouse requires an ENGINE clause. The MergeTree engine is commonly used as it is optimized for high data ingestion and large datasets, offering significant performance benefits.
Command:
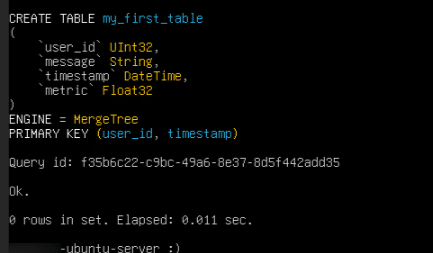
CREATE TABLE my_first_table

(

user_id UInt32,

message String,

timestamp DateTime,

metric Float32 )

ENGINE = MergeTree

PRIMARY KEY (user_id, timestamp)
- After entering the values, hit Enter.
Note: To go to next line in the terminal, press Alt+Enter.
26. You will the response as ‘OK’ as shown in the screen below:
27. INSERT DATA into the table:
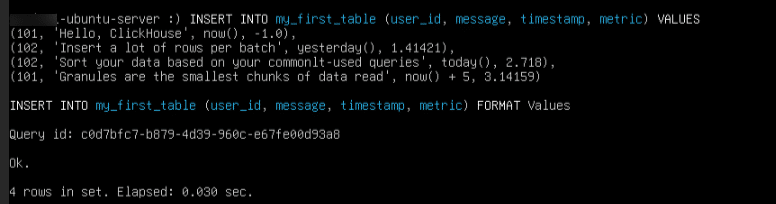
In ClickHouse, INSERT INTO TABLE creates a part in storage, which is later merged in the background. To optimize performance, bulk inserts of thousands or millions of rows are recommended. For now, insert a few rows using the following command:
Command:
INSERT INTO my_first_table

(user_id, message, timestamp, metric) VALUES

(101, 'Hello, ClickHouse!', now(), -1.0 ),

(102, 'Insert a lot of rows per batch', yesterday(), 1.41421 ),

(102, 'Sort your data based on your commonly-used queries', today(), 2.718 ),

(101, 'Granules are the smallest chunks of data read', now() + 5, 3.14159 )
- After entering the values, hit Enter.
You can see the message as ‘OK’.
28. QUERY THE TABLE:
You can execute a SELECT query just as you would in any SQL database.
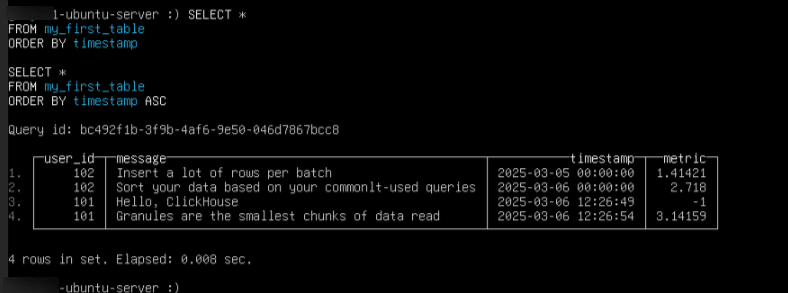
Command:
SELECT *
FROM my_first_table
ORDER BY timestamp
You will see the output displayed in a table format, as shown in the screen below.
29. INSERT CUSTOM DATA (YOUR OWN DATA):
The below query uses the s3 table function in ClickHouse to read data directly from an S3 bucket without prior ingestion. It treats the file as a table, enabling ad-hoc queries or data import into ClickHouse later.
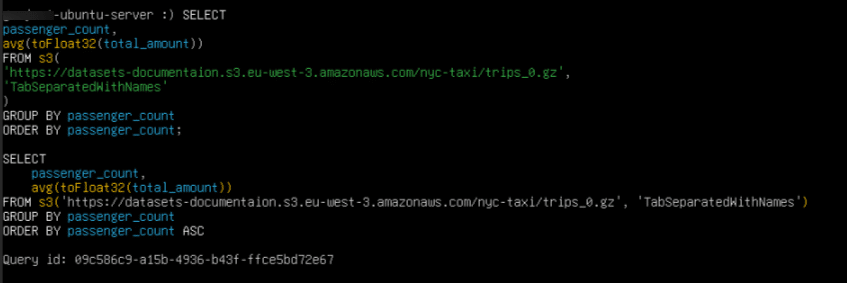
QUERY:
SELECT

   passenger_count,

   avg(toFloat32(total_amount))

FROM s3(

    'https://datasets-documentation.s3.eu-west-3.amazonaws.com/nyc-taxi/trips_0.gz',

    'TabSeparatedWithNames'

)

GROUP BY passenger_count

ORDER BY passenger_count;
Query Breakdown:
- s3(): It reads the dataset from S3 in TabSeparatedWithNames format.
- SELECT passenger_count, avg(toFloat32(total_amount)): This calculates the average fare per passenger.
- GROUP BY passenger_count: This groups results by passenger count.
- ORDER BY passenger_count: This sorts the output.
This allows quick analysis of large datasets without moving them into ClickHouse first.
30. MOVING THE DATA INTO CLICKHOUSE TABLE:
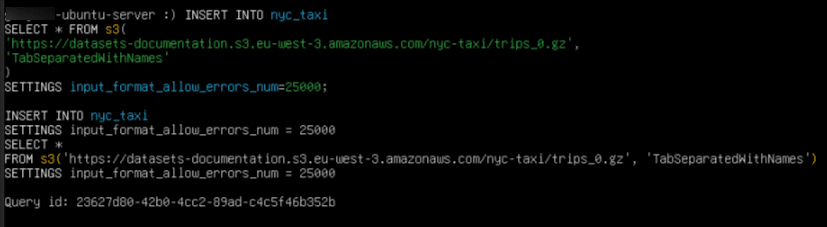
The below command moves data from an S3 source into a ClickHouse MergeTree table named nyc_taxi.
Command:
INSERT INTO nyc_taxi

SELECT * FROM s3(

 'https://datasets-documentation.s3.eu-west-3.amazonaws.com/nyc-taxi/trips_0.gz', 'TabSeparatedWithNames' )

SETTINGS input_format_allow_errors_num=25000;
This command moves data from an S3 source into a ClickHouse MergeTree table named ‘nyc_taxi’. The INSERT INTO nyc_taxi statement specifies the target table. The SELECT * FROM s3(…) function retrieves the dataset from an S3 location in TabSeparatedWithNames format. The SETTINGS input_format_allow_errors_num=25000 option allows up to 25,000 errors while parsing the input data, preventing minor issues from stopping the entire import process.
31. There are various example datasets provided in the ClickHouse official website- https://clickhouse.com/docs/getting-started/example-datasets/nyc-taxi. Try them out.
32. To detach from the session, press Ctrl+b, d. This will detach from the current session.

33. Example scenarios of exit command:
Command:
exit
Note:
- If you’re inside an SSH session and run exit command, then you will be logged out of the remote server.
- If you are inside tmux and run exit inside a pane, it will close that pane.
- If you are inside tmux but outside a session (in the tmux command prompt), running exit closes tmux entirely if no sessions remain.
To avoid accidental disconnection: if you are inside a tmux session, use Ctrl + b, d to detach instead of exiting.

ClickHouse, a high-performance database optimized for analytics, delivers fast queries and efficient data processing through its column-oriented storage and real-time capabilities. Deploying it on Kamatera enhances scalability and flexibility, making it an ideal solution for handling large datasets and complex analytical workloads.