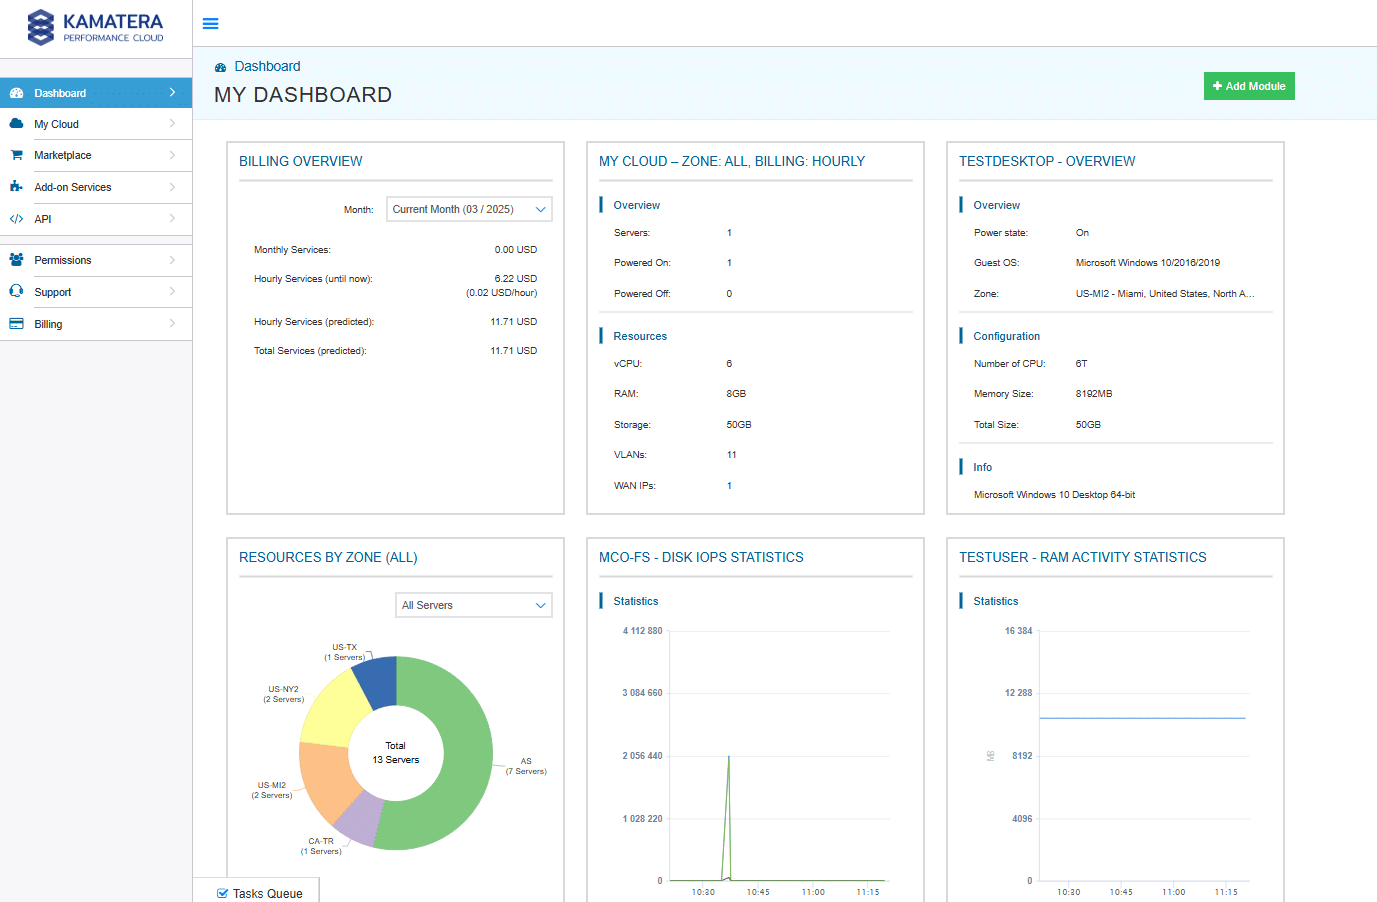
Your cloud’s early warning system
Kamatera’s cloud server monitoring gives you a clear picture of what’s happening in your cloud. That way, you can catch problems early and keep things running smoothly, no surprises.
Our monitoring solution is used and trusted by businesses worldwide because it’s scalable to any size. Continuous platform enhancements will make sure you always have the latest security updates, performance metrics, and data analysis dashboards. Email/SMS alerts, load balancing management, operating system updates, and backups and restore administration are just some of the ways our monitoring can work for you.
Key Monitoring Features


Have questions? Speak with a specialist.
Frequently Asked Questions
Our monitoring solution tracks a wide range of critical metrics including CPU utilization, memory usage, disk I/O, network throughput, application response times, error rates, security events, and custom metrics you define. The platform collects data at customizable intervals to provide both real-time operational awareness and historical performance analysis.
Kamatera cloud monitoring features a flexible alerting system that allows you to set thresholds for any monitored metric. When thresholds are crossed, the system can trigger notifications through multiple channels including email, SMS, webhook integrations with tools like Slack or Microsoft Teams, and automated incident management systems. You can configure alert severity levels, notification rules, and escalation policies to match your operational requirements.
Yes, our monitoring platform offers extensive integration capabilities with popular DevOps, ITSM, and communication tools. Key integrations include Slack, PagerDuty, ServiceNow, Jira, Microsoft Teams, and Zapier. Additionally, our open API allows you to build custom integrations with internal systems and specialized tools in your technology stack.
Yes, Kamatera cloud monitoring includes automated remediation capabilities through configurable response scripts. You can create automation workflows that execute predefined actions when specific conditions are detected, such as restarting services, scaling resources, or deploying failover systems. These automations can be tested in simulation mode before being deployed to production environments.
Kamatera cloud monitoring includes a customizable dashboard interface where you can create visual representations of your monitoring data. The platform offers various visualization types including time-series graphs, heat maps, status boards, and alerting timelines. You can also schedule automated reports for delivery to stakeholders and export monitoring data in multiple formats for further analysis or compliance requirements.
Yes, our monitoring platform is designed with compliance requirements in mind. It maintains detailed audit logs of all monitoring activities, supports role-based access control for sensitive metrics, and includes data retention policies configurable to meet regulatory requirements. The platform helps organizations meet obligations under frameworks like GDPR, HIPAA, SOC 2, and PCI DSS by providing the necessary visibility and documentation of infrastructure security controls.
Getting started is simple—existing Kamatera customers can enable monitoring through the console with a single click. The system automatically discovers your resources and begins collecting standard metrics immediately. Our quickstart templates provide pre-configured dashboards and alerts for common applications and infrastructure patterns. For new customers, monitoring can be added during the initial server provisioning process. Our technical team offers free onboarding assistance to help you configure custom metrics, alerts, and integrations.
Retention periods vary by plan, with options for extended storage based on compliance or operational needs.
There are various ways to reach Kamatera’s technical support. You can:
Open a ticket through the management console
Send a message to support@kamatera.com
Call our technical support team at any time, from any time zone.


